Explanation of metrics #37
Comments
|
There is no official documentation (as far as I know) from Elastic team, but most of the important metrics are these: If you feel like delving and figuring out everything, PR is welcome to update help messages of metrics |
|
@shivas can you please advise on what's the difference between Also, which metric would indicate connection issues to logstash/elasticsearch? Thanks! |
|
Also there's |
|
+1 here. I'm trying to understand how many messages we are collecting and sending but i'm not sure what's up from down. |
|
+1 agree would be great to have some documentation something like this https://github.com/ClusterLabs/ha_cluster_exporter/blob/master/doc/metrics.md |
|
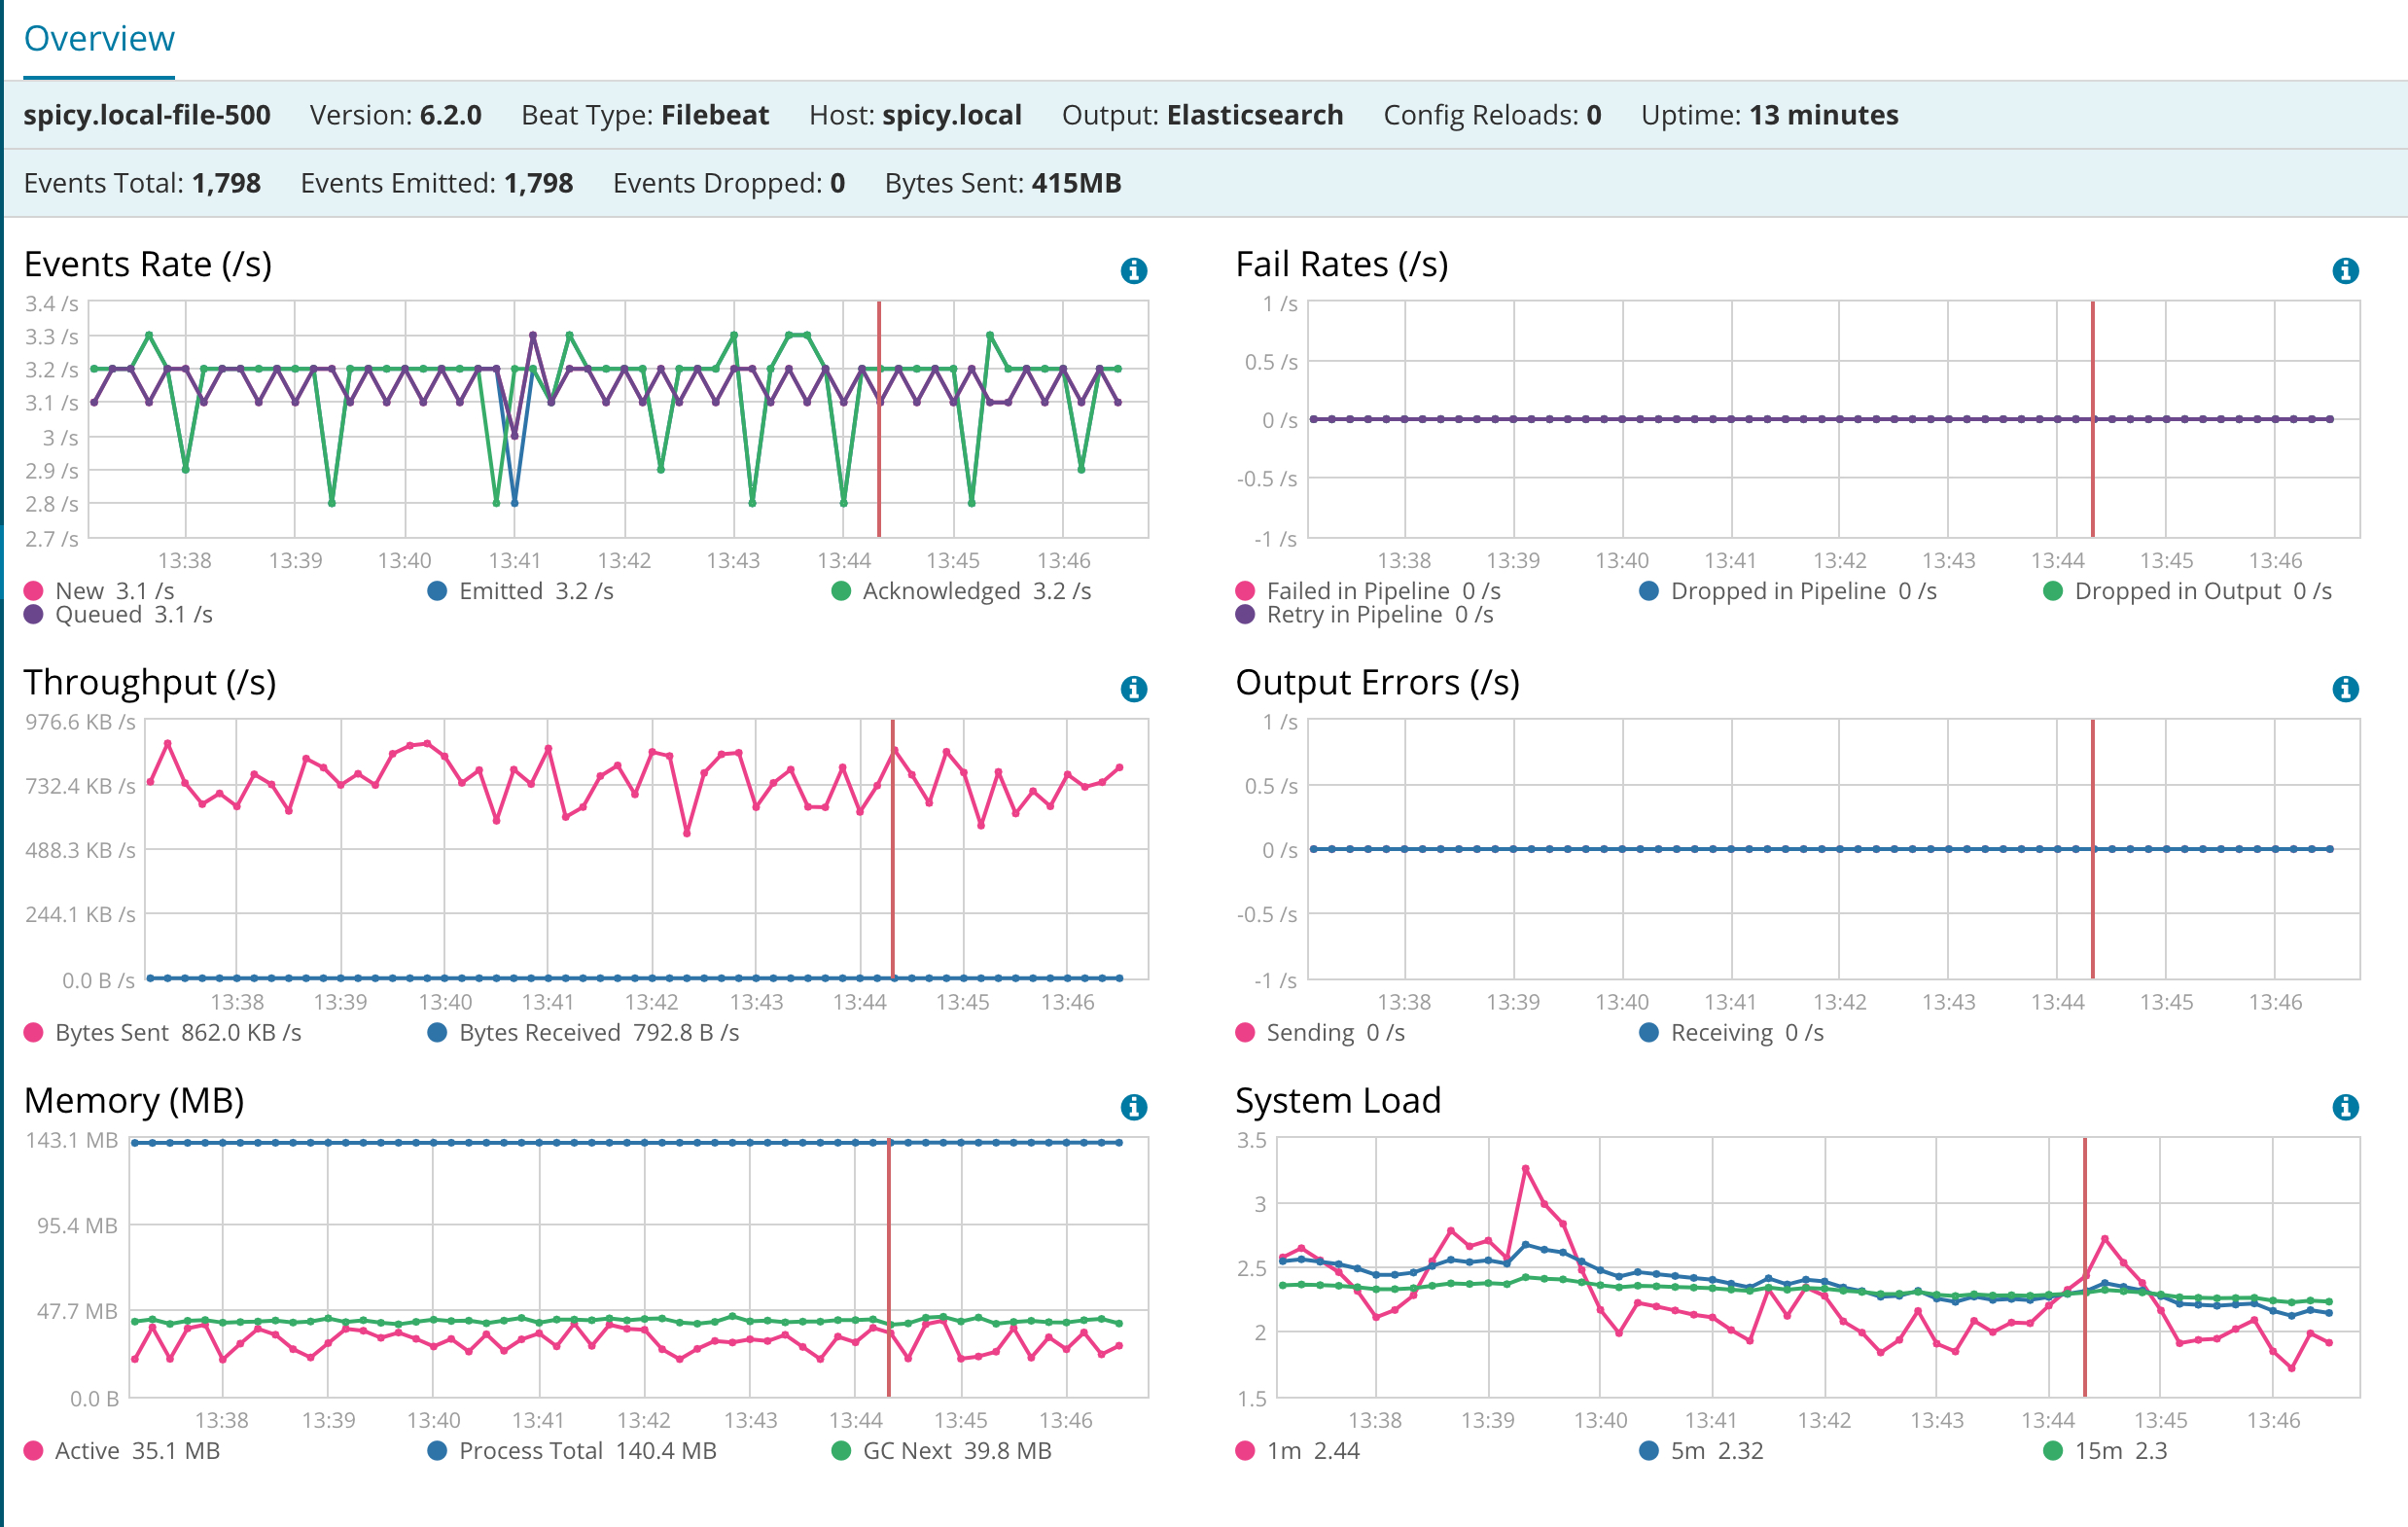
+1. A bit of semantics can be read out of the official Kibana Filebeat monitoring built-in, but that is just a screenshot with very limited explanatory potential. |
|
+1 |
1 similar comment
|
+1 |
|
This metric appears to be related to the events waiting to be sent: ---
apiVersion: monitoring.coreos.com/v1
kind: PrometheusRule
metadata:
labels:
{{- include "alert-rules.labels" . | nindent 4 }}
{{- include "common-library.labels" . | nindent 4 }}
name: alert-rules-filebeat
spec:
groups:
- name: alert-rules-filebeat
rules:
- alert: FileBeatQueueEmpty
expr: |
filebeat_libbeat_pipeline_events{type="active"} == 0
for: 30m
labels:
severity: warning
annotations:
description: Filebeat queue is empty
- alert: FileBeatQueueGrowing
expr: |
filebeat_libbeat_pipeline_events{type="active"} > 500 and
delta(filebeat_libbeat_pipeline_events{type="active"}[15m]) > 0
for: 15m
labels:
severity: warning
annotations:
description: |
{{ `Filebeat queue is {{printf "%.0f" $value}} and growing` }}
|

Love the exporter, but is there somewhere with a good description of what each of the metrics tracks?
The text was updated successfully, but these errors were encountered: